
Trends
Restaurant Data Intelligence Platform
Custom Apps

.png?width=48&height=48&name=Conrad%20Face%201%20(1).png)
Labor is the largest controllable cost in most restaurants. It is also the cost that franchise systems are most likely to manage with a copied template, a manager's memory of last year, and a target percentage handed down from above.
That approach used to be good enough. The margin has since gotten too thin to absorb the guesswork.
The National Restaurant Association's 2025 Restaurant Operations Data Abstract put salaries and wages, including benefits, at a median of 36.5% of sales for full-service respondents in 2024, and 31.7% for limited-service. Across the 2010, 2013, and 2016 editions of the same report, those readings averaged roughly 33% and 28%. The Association also estimates total expenses for an average restaurant rose 36% between 2019 and 2026, with average hourly earnings of restaurant employees up 41% from pre-pandemic levels. Forty-two percent of operators said their restaurant was not profitable in 2025.
Three or four points of labor variance across a 40-location system is real money. Finding those points is a data problem before it is a scheduling problem, which is why restaurant business intelligence tools have moved from a nice-to-have for large chains to a working requirement for growing franchise groups.
This guide covers what labor forecasting requires, how restaurant analytics fits into the weekly staff scheduling cycle, which metrics are worth tracking, and how to roll the practice out across locations without stalling.
A single restaurant with a tenured GM can schedule reasonably well from experience. That manager knows the Thursday patio rush, the youth soccer tournament in the spring, and which two cooks can cover a bad night together.
None of that knowledge travels. Open five more locations and you now have six versions of how we schedule, with no consistent way to tell whether a location is overstaffed or just busier than its neighbor.
The problems show up in a predictable order:
Franchise operators feel this more sharply than corporate chains because accountability is split. A franchisee owns the P&L for their locations. The franchisor owns the brand standard. Neither side benefits from a labor conversation that turns into an argument about whose number is right.
Labor forecasting is the practice of predicting how much staffing a location needs, by role and by time interval, before the week starts. It has four inputs, and most restaurants only have reliable access to one of them.
Daily sales totals are close to useless for scheduling. You need forecasted demand in 15- or 30-minute intervals, because that is the resolution at which shift start times, breaks, and cut times get decided.
A good interval forecast draws on at least two years of location-level history, adjusted for day of week, daypart, holiday calendars, promotions, weather, and local events. It also has to account for channel mix. A location doing 40% of its volume through third-party delivery has a different labor curve than one doing 90% dine-in at the same revenue.
Forecasted demand becomes a staffing plan only when you can convert transactions into hours. That conversion is a set of standards: how many covers a server can handle at a given service style, how many orders per hour a line position can hold, what fixed coverage a location needs regardless of volume.
Most operators have these standards written somewhere. Fewer keep them current, and fewer still adjust them by location format or equipment package.
A forecast that ignores reality produces schedules that managers immediately override. The constraints that matter most:
The last input is the one most often skipped. Forecast accuracy improves only when someone compares the forecast to what happened, identifies why the gap occurred, and adjusts. Without that step, the model never learns and neither does the team.
Scheduling software and business intelligence software solve different problems in restaurant operations, and confusing the two is a common reason labor projects stall.
| Scheduling and labor management software | Restaurant business intelligence tools | |
|---|---|---|
| Primary job | Build, publish, and manage the schedule | Explain what happened and what is likely to happen next |
| Data scope | Labor system data | POS, labor, inventory, guest feedback, finance, and third-party channels combined |
| Time horizon | This week and next | Multi-year history and forward projections |
| Typical output | A published schedule and a labor budget | Variance analysis, anomaly alerts, forecasts, and cross-location comparison |
| Who uses it | GMs and shift leaders | VPs and directors of operations, regional managers, franchisees, GMs |
Your scheduling system is the system of record for shifts. It is generally not designed to reconcile POS sales against payroll hours across brands, normalize job titles between two different labor providers, or tell a regional manager which five of their 22 locations are drifting.
That reconciliation and comparison work is what a business intelligence layer handles. The two work together: BI produces the demand picture and the variance signal, the scheduling system acts on it.
This step is boring and you cannot skip it. Labor analytics built on inconsistent inputs produce confident numbers that are wrong.
Four fixes do most of the work. Every job title has to map to one common set of role names, so "COOK_LINE_1," "AM Line," and "Kitchen 1" resolve to the same position across every location and every system. Employee records need matching across systems, or rehires and misspelled names quietly become duplicate people. Then there is the time model: sales and labor have to agree on what a week is, or labor percentage means one thing to a GM and something else to a CFO. Pay codes are the fourth. Overtime, premium pay, and tip credit get handled differently by different payroll providers, and those differences will distort any comparison you run across locations.
We covered this in more depth in The Labor Data Problem Most Restaurants Don't Know They Have. If you skip normalization, every downstream number is a debate waiting to happen.
Step 2: Build the interval forecast at the location level
Forecast each location separately. System-level averages hide the variance that scheduling decisions depend on.
Start with 104 weeks of history where you have it. Model day of week and daypart first, then layer in the adjustments that matter for your concept:
Machine learning models handle this well because the interactions between these factors are not linear, and a human building a spreadsheet will flatten them.
Set an accuracy expectation before you start. Mean absolute percentage error under 10% at the daily level and under 15% at the interval level is a reasonable target for a stable location. New openings and locations with volatile catering business will run worse, and that is fine as long as you know it.
Step 3: Convert the forecast into role-level labor demand
Apply your labor standards to the forecast to produce required hours by role and interval. The output should look like a staffing curve, not a single headcount number.
This is where fixed and variable labor need to be separated. A manager on salary and an opening prep cook are fixed coverage. A third register during the noon peak is variable. Blending them together produces a labor model that looks efficient on paper and understaffs the peak.
Review the standards themselves at least twice a year. Menu changes, new equipment, and shifts in channel mix all change how long tasks take.
A single system-wide labor percentage target does not survive contact with a real portfolio. Wage markets, service models, and footprints vary too much for one number to mean the same thing everywhere.
Set a company-level benchmark, then define location-level exceptions based on wage market, service model, sales volume, and format. A location in a high minimum wage market with a small footprint should have a different target than a high-volume suburban store, and holding both to 28% teaches your regional managers to ignore the report.
Then define the variance threshold that triggers attention. Something like "flag any location running more than 1.5 points above target for three consecutive days" is specific enough to act on and narrow enough to stay credible.
Run a standing weekly review that compares forecast to actual and schedule to actual. Three questions are worth asking every time:
Document the answers. Over a quarter, this record becomes the most valuable input to your model, because it captures the local knowledge that no data feed contains. Data-driven decision making at this level is a standing 30-minute meeting with a short agenda. It does not need to be bigger than that.
Most labor dashboards track too many things. This is a workable core set for franchise workforce planning.
| Metric | Definition | Why it matters |
|---|---|---|
| Labor % of sales | Total labor cost divided by net sales | The headline number, best used against a location-specific target |
| Sales per labor hour (SPLH) | Net sales divided by total hours | Productivity measure that is less distorted by wage rate differences |
| Overtime % | Overtime hours divided by total hours | Often the fastest available savings and a leading indicator of understaffing |
| Schedule vs. actual variance | Scheduled hours compared to hours logged | Shows whether the plan or the execution is the problem |
| Forecast accuracy (MAPE) | Average absolute percentage error of the sales forecast | Tells you how much to trust the staffing plan built on it |
| Hours by role vs. plan | Actual hours by canonical role against the modeled requirement | Locates the specific position where the drift is happening |
| Turnover and tenure by location | Rolling turnover rate and median tenure | Explains persistent forecast misses at chronically short-staffed locations |
Labor percentage alone will make a high-volume location look efficient and a low-volume location look wasteful, even when the second is scheduling better. Always read it alongside SPLH. And overtime percentage that stays flat while turnover climbs usually means your remaining staff are covering gaps, which means you will lose those people before the cost shows up.
Franchise systems hit a few obstacles that corporate chains do not, and most of them trace back to the fact that no single party owns all the data.
Access has to be controlled at the data layer. A franchisee should see their own locations in full detail and should never see another franchisee's P&L, while a regional manager needs a roll-up across owners. Building that into a dashboard filter is fragile, and one misconfigured view can end a franchisee's willingness to share data at all. Role-based access enforced where the data lives is what makes cross-system reporting politically viable in the first place.
Systems also differ by owner. One franchisee runs Toast, another is still on a legacy POS, a third uses a payroll provider nobody else in the system has heard of. You are not going to standardize everyone's tech stack, so normalization has to happen at the platform level if you want comparable numbers.
Incentives differ too. Franchisees optimize for their own unit economics while the franchisor optimizes for brand consistency and system growth. Labor analytics gain adoption faster when the reporting gives franchisees something they can use in their own business. Compliance scoring for the brand does not motivate anyone to open the report.
Benchmarking only works with real peer groups. Ranking a 40-seat urban location against a suburban store with a drive-thru tells you very little about either one. Group locations by format, volume band, and wage market first, then rank.
We wrote more about the cultural side of this in Building a Data-Driven Culture in Franchise Operations.
Most labor forecasting programs fail because the scope got away from them. This sequence keeps it contained.
Days 1 to 30: foundation. Connect POS, labor, and payroll data. Normalize job titles and employee records. Agree on definitions for labor percentage, overtime, and hours so that everyone is measuring the same thing. Pick five to eight pilot locations that represent your range of formats and volumes.
Days 31 to 60: model and validate. Build the interval forecast for the pilot group and backtest it against the last 12 weeks. Publish accuracy openly, including where it is weak. Set location-level targets and variance thresholds. Run the forecast in parallel with existing scheduling practice and let GMs compare.
Days 61 to 90: operate and expand. Move the pilot locations to forecast-driven schedules. Start the weekly variance review. Track what changes and be specific about it: hours by role, overtime percentage, labor percentage against target, and forecast accuracy. Once the pilot group holds for three consecutive weeks, expand one region at a time.
Resist the pull to add inventory, waste, and guest satisfaction analytics during the first 90 days. Every additional domain brings another set of definitions to argue about, and the labor definitions are not settled yet. Those domains can wait a quarter.
OpSage by CONVX was built for the part of this that most operators cannot staff internally: getting POS, labor, payroll, inventory, and guest data into one clean data model with access controls, without hiring a data team.
For labor specifically, the platform normalizes employee records and job titles into a canonical taxonomy, connects labor data to sales inside the same model, tracks labor percentage and overtime against location-level targets, and flags anomalies while the week is still running. Role-based access is enforced at the data layer, so franchisees, regional managers, and corporate leadership each see the scope appropriate to their role.
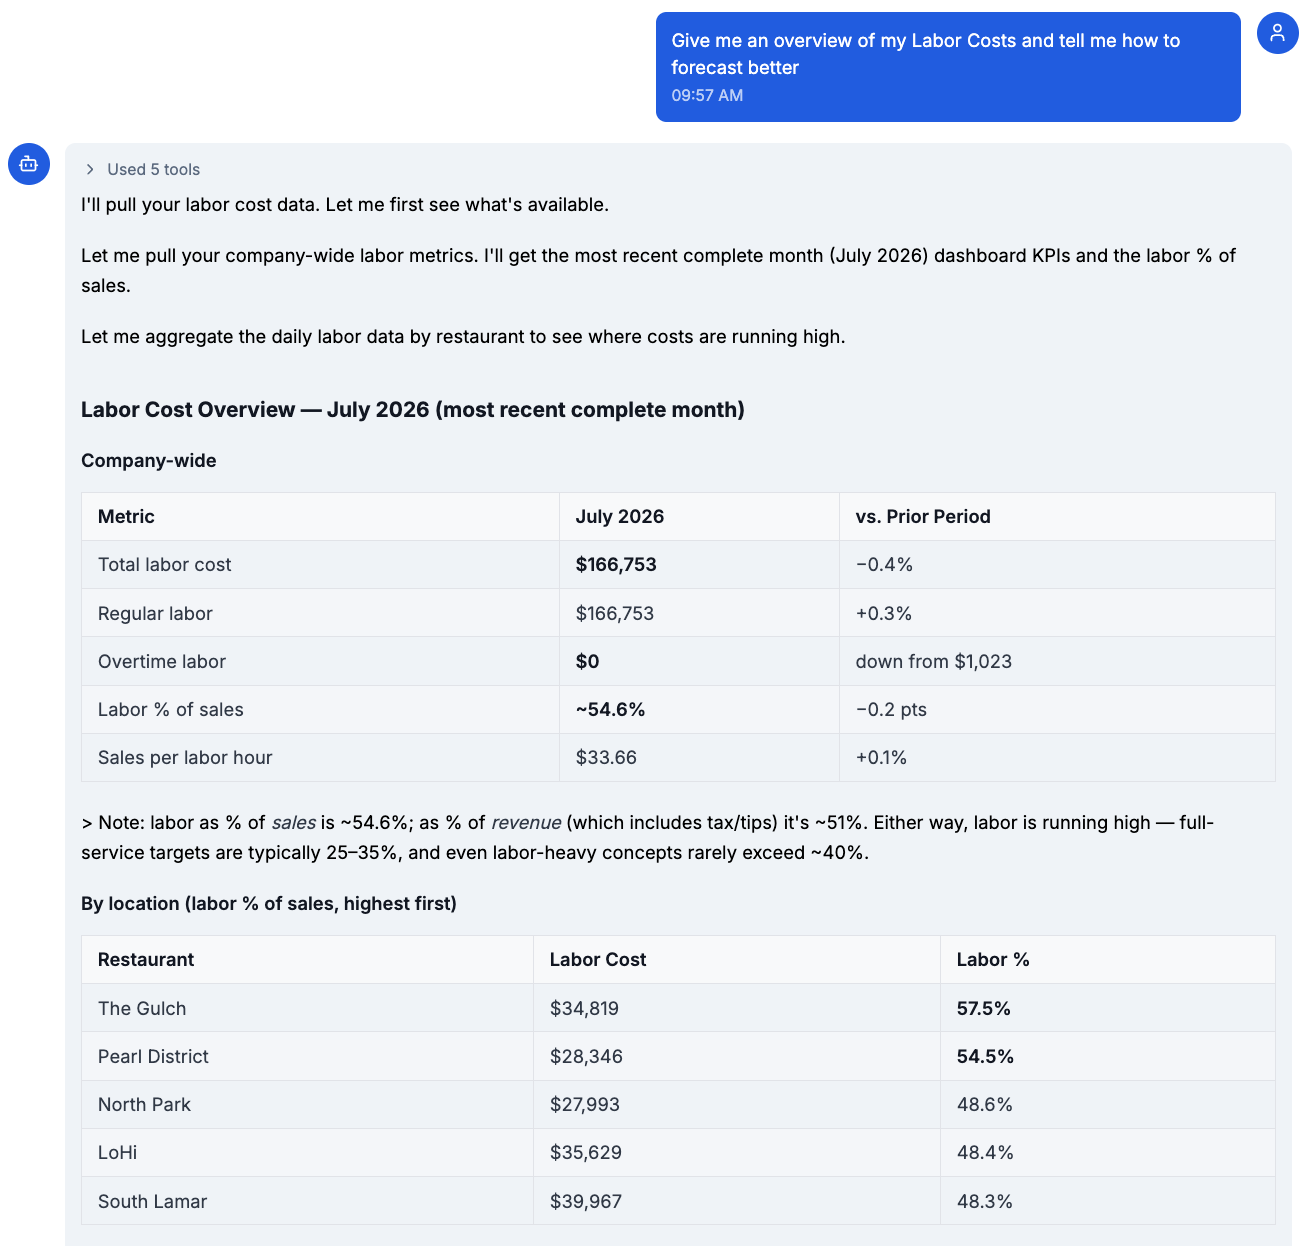
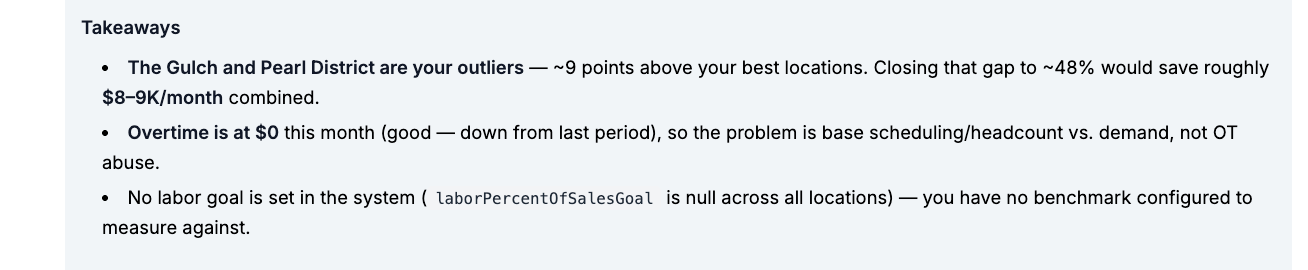
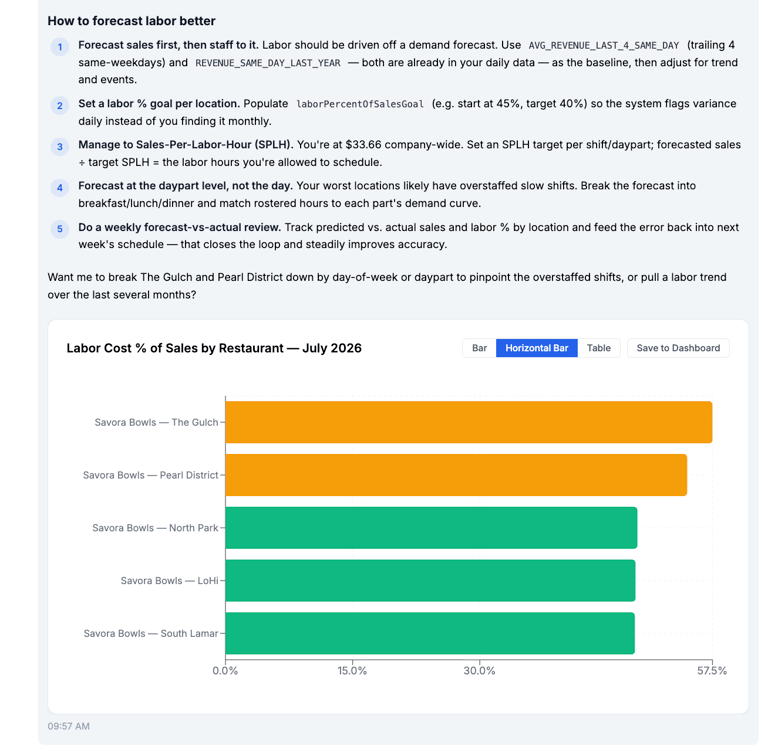 As you can see, field leaders can ask OpSage questions in plain language and get an answer grounded in their own data, including through Claude, ChatGPT, Gemini, Microsoft Copilot, or Slack. The March 2026 release added multi-step reasoning and more than 15 labor analytics question types, so a regional manager can ask which of their locations ran over labor target last week and follow up on why without opening a report.
If you want a low-risk starting point, do this: pick your five most different locations, pull 24 months of sales and labor history, and check whether you can produce a clean, comparable labor percentage for all five without a spreadsheet reconciliation.
If you can, you are ready to forecast. If you cannot, that gap is the actual project, and it is a shorter one than most operators expect.
Book a demo and we will walk through labor forecasting with your data.
Suggested internal links used:
Sources cited:
National Restaurant Association, 2025 Restaurant Operations Data Abstract, via https://www.restaurant.org/research-and-media/research/restaurant-economic-insights/analysis-commentary/restaurant-labor-costs-are-well-above-historical-averages/
National Restaurant Association, "Elevated costs continue to pressure restaurant profitability," July 8, 2026, https://www.restaurant.org/research-and-media/research/restaurant-economic-insights/analysis-commentary/elevated-costs-continue-to-pressure-restaurant-profitability/